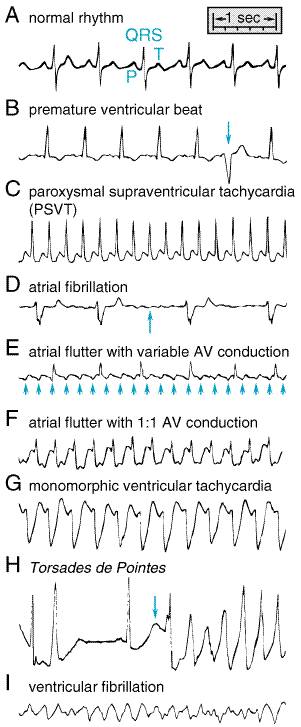
ECGs Showing Normal and Abnormal Cardiac Rhythms. The P, QRS, and T waves in normal sinus rhythm are shown in panel A. Panel B shows a premature beat arising in the ventricle (arrow). Paroxysmal supraventricular tachycardia (PSVT) is shown in panel C; this is most likely reentry utilizing an accessory pathway or reentry within or near the AV node. In atrial fibrillation (panel D), there are no P waves and the QRS complexes occur irregularly (and at a slow rate in this example); electrical activity between QRS complexes shows small undulations (arrow), corresponding to fibrillatory activity in the atria. In atrial flutter (panel E), the atria beat rapidly, approximately 250 beats per minute (arrows) in this example, and the ventricular rate is irregular. If a drug that slows the rate of atrial flutter is administered, 1:1 atrioventricular conduction (panel F) can occur. In monomorphic ventricular tachycardia (VT, panel G), identical, wide QRS complexes occur at a regular rate, 180 per minute. The electrocardiographic features of the torsades de pointes syndrome (panel H) include a very long QT interval (>600 ms in this example, arrow) and ventricular tachycardia in which each successive beat has a different morphology (polymorphic VT). Panel I shows the disorganized electrical activity characteristic of ventricular fibrillation.